Author Archives: sschwochau

How long does a criminal appeal take in the Third Circuit?

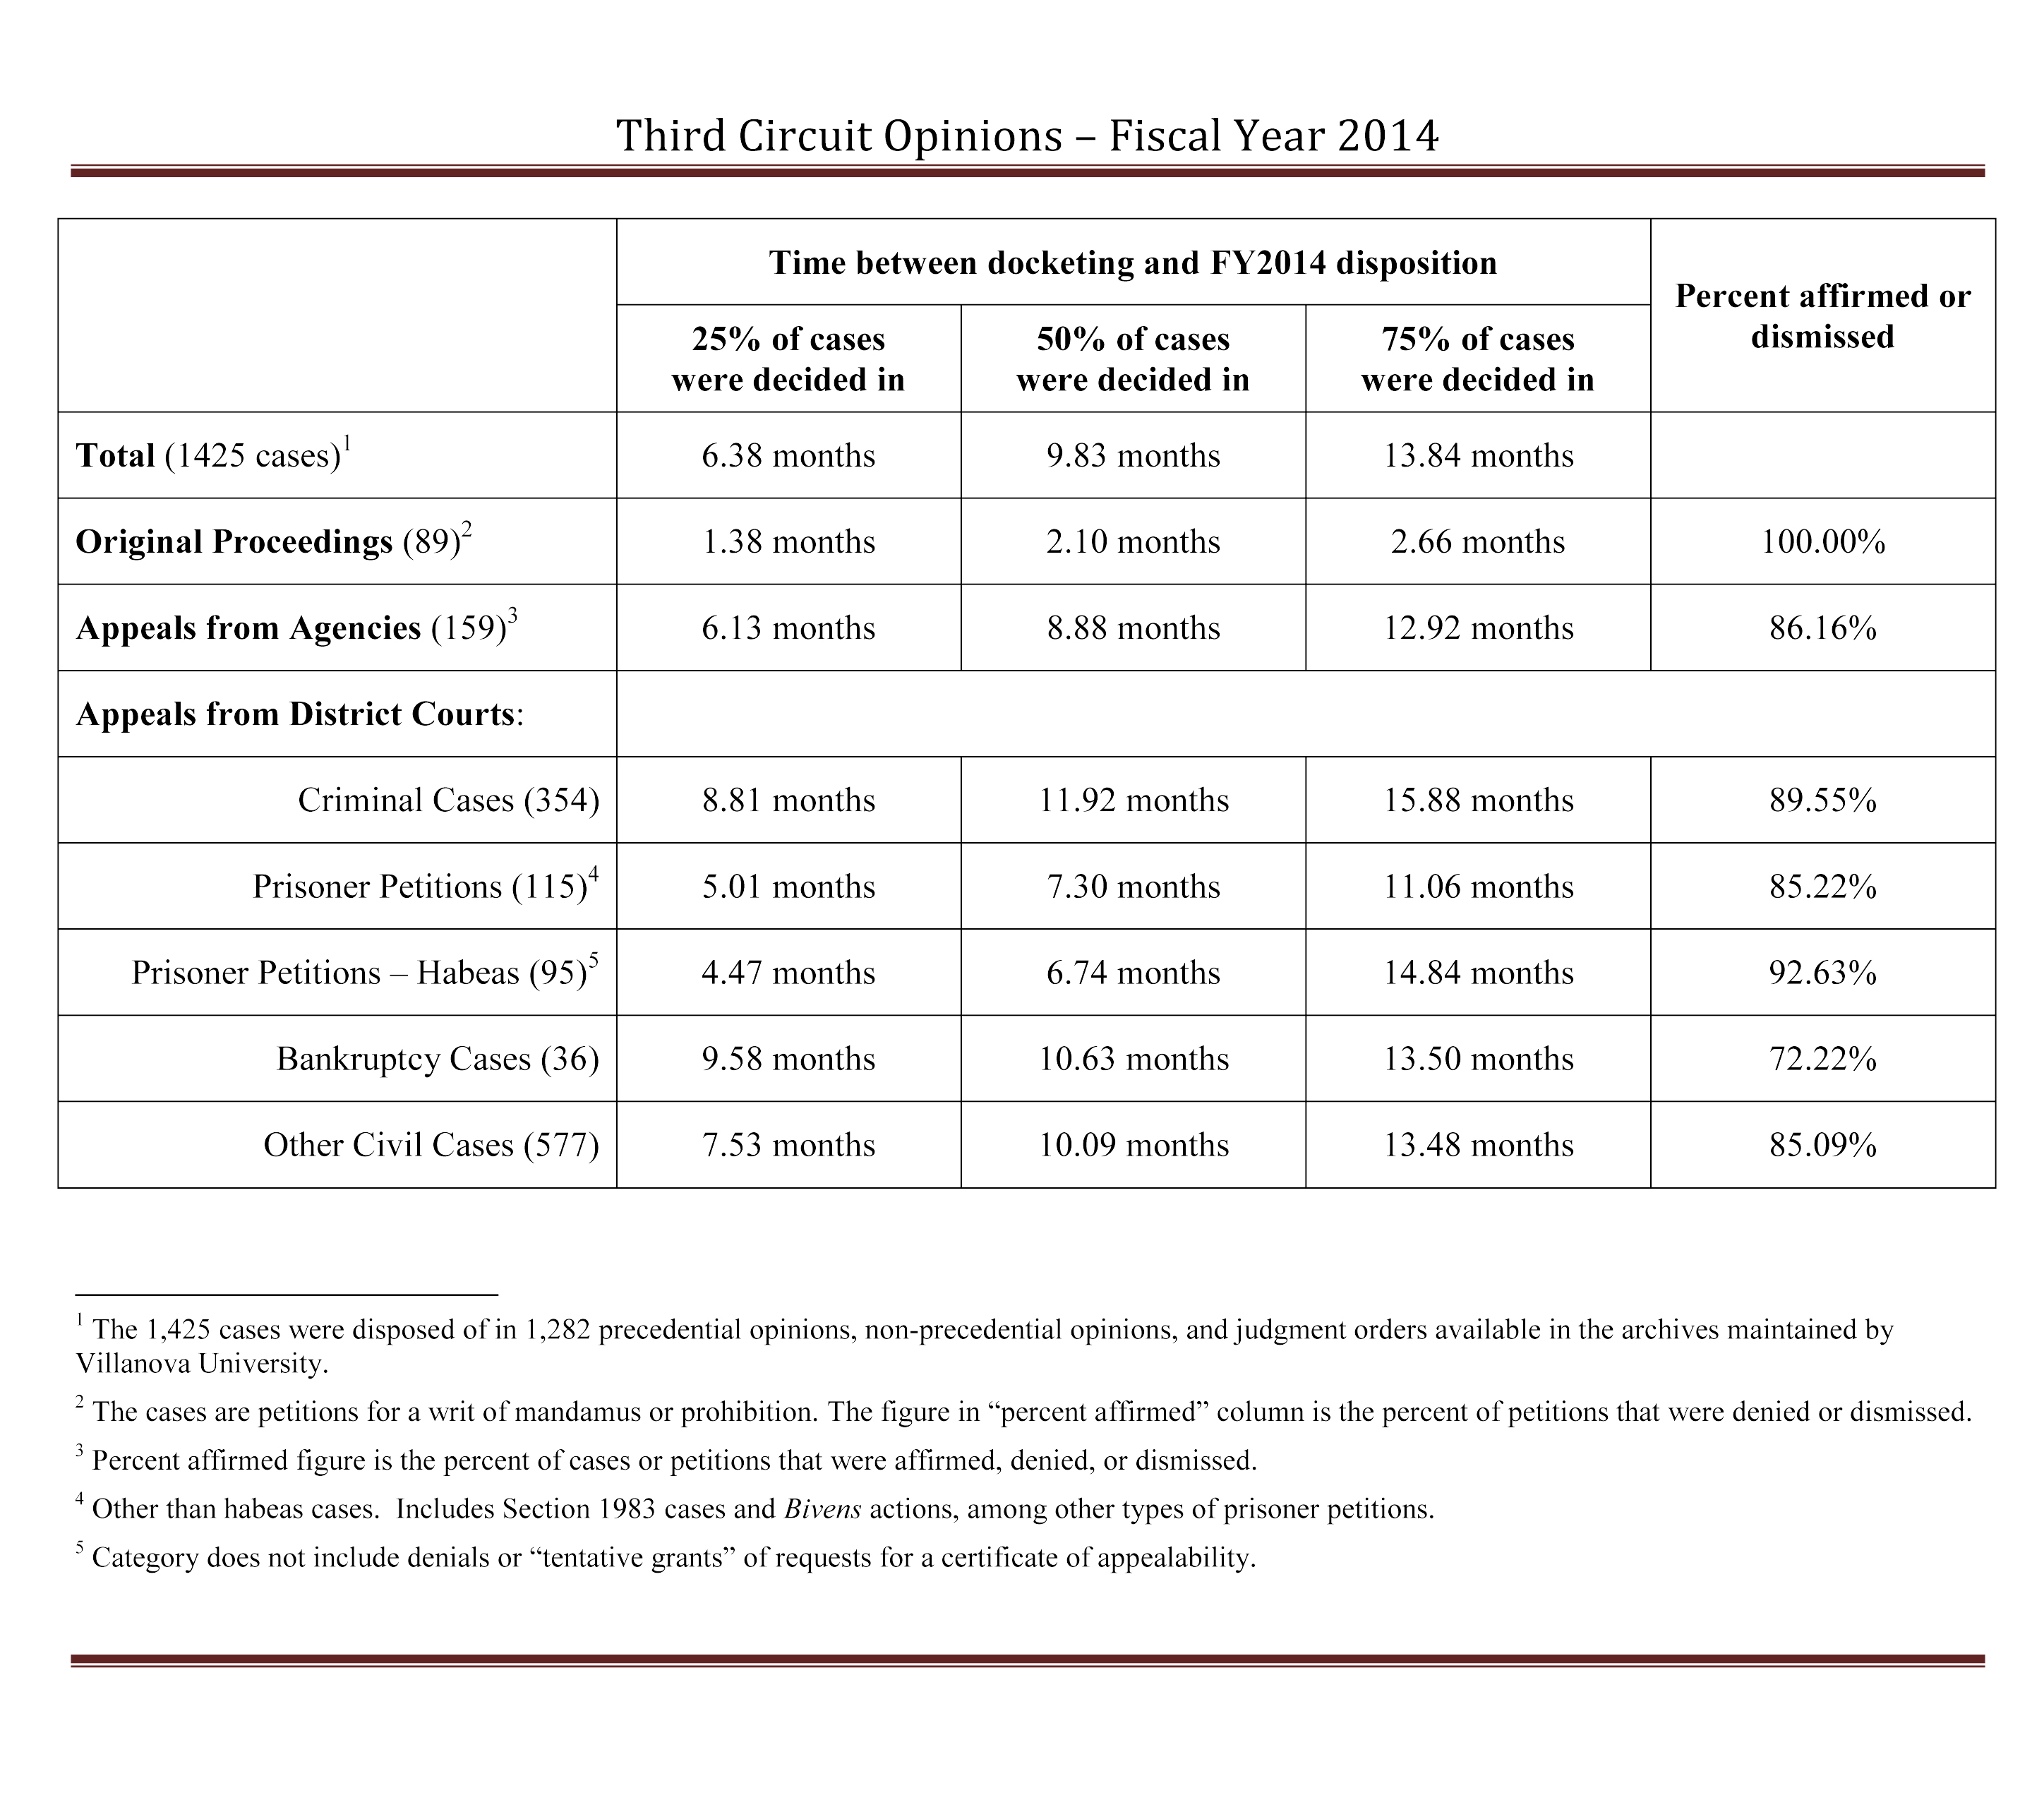
An internet search of the question “how long does a federal criminal appeal take” reveals multiple blogs, articles, and yes, even YouTube videos that say “about a year,” “longer than what you’d expect,” “a long time,” among other such answers. I’ve posted statistics (see here and here) that suggest that in the last couple fiscal years, 50% of criminal cases the Third Circuit decided took about 12 months or less (from the date of docketing in the circuit court to the date of decision) and 75% of those cases took about 16 months or less.  Based on these statistics, a conservative estimate of how long a criminal appeal takes in the Third Circuit is 16 months.

But it stands to reason that not all criminal appeals are alike – an appeal after a jury trial and sentencing, for example, can be expected to take longer than an appeal from a denial of a motion to modify a sentence under 18 U.S.C. § 3582(c)(2).

Most, but not all, of the criminal appeals in my data sets are direct appeals from cases in which the defendant challenges his or her conviction, sentence or both. There are some direct appeals in which the government filed a cross appeal; other appeals were initiated solely by the government.  In my FY 2014 data set for the Third Circuit, I have:

  • 136 appeals from cases in which the defendant was convicted after a jury or bench trial (this includes 3 government-initiated cross appeals);
  • 115 appeals from cases in which the defendant was convicted after pleading guilty (this includes 5 government-initiated appeals);
  • 1 appeal from a case in which the defendant pleaded nolo contendere;
  • 15 cases returning to the Third Circuit after resentencing;
  • 28 appeals from revocations of supervised release;
  • 53 appeals seeking review of decisions on post direct-appeal motions and petitions (e.g., motions for a sentence reduction; Rule 36 motions; motions for return of forfeited property; petitions for a writ of coram nobis); and
  • 5 other cases seeking review of various “other” decisions. This is the group in which any government appeal of a grant of a motion to suppress or a motion to dismiss an indictment falls.

For appeals in the first group of 136 (conviction after trial):

25% of the appeals were decided within 11.07 months;
50% of the appeals were decided within 14.55 months (the median); and
75% of the appeals were decided within 18.73 months.

So these cases appear to take a bit longer than other criminal appeals (based on the 12 and 16 month figures above). This is confirmed by the following:

►Including the nolo contendere case in the group of appeals from cases in which the defendant pleaded guilty (for a total of 116 appeals):

25% of the appeals were decided within 9.03 months;
50% of the appeals were decided within 11.47 months (the median); and
75% of the appeals were decided within 15.07 months.

►The median time to decision for the 28 appeals from revocations of supervised release was 10.17 months; 75% of these cases were decided within 12.43 months;

►The median time to decision for the 53 appeals from post direct-appeal motions (which does not include habeas petitions) was 5.10 months; 75% of these appeals were decided within 10.32 months.

In short, how long a criminal appeal takes in the Third Circuit depends on the nature of proceeding leading up to the appeal. It can take a year and half in the case of appeals from jury trials, but if what is being challenged is a denial of a Rule 36, Rule 35, or other post-direct appeal motion or petition, the appeal can be decided in substantially less than a year.

Labor appeals in the Third Circuit: Is your chance of any success less than 1 in 10 or closer to 1 in 4?

You represent plaintiffs in a Fair Labor Standards Act case.  Yesterday you received notice that the district court granted the defendant’s Rule 12(b)(6) motion and dismissed all your claims. Being a rational lawyer, you’ve set aside your feelings of anger and frustration and are looking for information on what the chances might be that the Third Circuit will reverse or vacate any part of the judgment on appeal.  You’d be happy with an outcome that allows you to proceed with at least some of your original claims.

The Administrative Office of the U.S. Court’s recently published statistics show you that in FY 2014, 8.7% of all “Other Private Civil” appeals were reversed. See Table B-5. Based on that number, it seems you have a less than a 1 in 10 chance.  Now you’re really depressed.

But all is not lost. First, the 8.7% figure does not reflect partial victories; appeals in which the judgment was reversed in part are included in the “Affirmed” column in the Administrative Office’s statistics.  (Check out the fine print at the bottom of Table B-5).  That means 8.7% may be an estimate of complete success, but it does not reflect partial success.

Second, the best that can be said about the cases that 8.7% is based on is that they do not include criminal cases, U.S. prisoner petitions, other U.S. civil cases, private prisoner petitions, bankruptcy cases, administrative agency appeals, or original proceedings. In short, Fair Labor Standards Act cases are in the category of “other private civil” cases, but so are antitrust, intellectual property, employment discrimination, tort, contract, and a host of other cases.

Using data I’ve collected, I’ve posted before some information on the percent of various types of civil-case appeals the Third Circuit affirmed or dismissed (and thus reflect, when subtracted from 100, the percentage of appeals in which the appellant gained some change in the district court’s judgment).  That information was only for FY 2013.  I now have similarly detailed information for FY 2010 through FY 2014, along with percentages across those five years.  Percent of Other Civil Appeals Affirmed or Dismissed, by Case Type and Fiscal Year. (This Table is also posted on the Statistics page, under “Third Circuit Statistics.”)  The numbers in the Table are far from ideal – they do not reflect, for example, the percent of judgments affirmed in Fair Labor Standards Act cases – but they are more useful than what’s generally available.

Within a case-type category (e.g., Tort), the figures in the Table bounce around a bit across years.  Because the bounces generally don’t reflect a trend up or down, I’ve computed a five-year figure as well (the last column) that shows the percent affirmed or dismissed across all appeals in the same category over the FY 2010 to FY 2014 period.

Fair Labor Standards Act cases are in the “Labor” category. Per-fiscal year figures for Labor cases range from a high of 82.2% in FY 2010 to a low of 63.3% in FY 2012.  In my FY 2014 data set, the judgment was affirmed or dismissed in 67.6% of Labor appeals.  Across the five years, the number is 74.2%.  So, my data suggest that the Third Circuit affirmed the district court’s judgment or dismissed the appeal in just over 74% of the Labor appeals it decided between FY 2010 and FY 2014.  That suggests a 1 in 4 chance of getting some sort of relief from the district court’s judgment.

To get a sense of how “low” this number is, look at the comparable overall percent for all “other civil appeals” – it’s 83.2%. In short, it appears that judgments in Labor cases have a much smaller chance of being affirmed or dismissed than most every other type of civil appeal reflected in the Table.  In fact, Labor appeals in my data set had the smallest percent affirmed or dismissed of all “other” civil cases for three of the five years shown.  That translates to a higher probability of success for the appellant.

Feeling any better now?


New FY2014 Statistics

I finally have some basic statistics for FY 2014 (October 1, 2013 to September 30, 2014).  As before, the “cases” in the table below are appeals and petitions decided by the Third Circuit, with every unique docket number being treated as a case.  To enlarge the table, just click on it.

Compared to FY 2013, see here, statistics for FY 2014 show fewer cases (1,425 versus 1,718 in FY 2013) but generally about the same amount of time between docketing and disposition (e.g., the median for all cases in FY 2014 was 9.83 months, exactly the same as in FY 2013).  The percent of cases affirmed, dismissed or denied goes from a low of 72.22% (for bankruptcy appeals) to a high of 100% (for petitions for a writ of mandamus or prohibition).  This is a wider range than was found for FY 2013.

Third Circuit Opinions – Fiscal Year 2014


The Third Circuit is going to hear argument in my appeal. Does that mean I’m going to win?

I’ve heard it said that “The Third Circuit will not reverse without oral argument” and that “Getting oral argument means you’re likely to win.” Turns out neither statement is true. Appeals in which the court hears argument are more likely than others to end with some modification to the judgment being reviewed. The probability of winning the appeal, however, is not anywhere near 100%.

Using appeals from district court judgments or orders in civil and criminal cases and appeals from administrative agency decisions, I created three categories of appeals that the Third Circuit disposed of in FY 2013: (1) appeals submitted under Local Rule 27.4 for “possible summary action”; (2) appeals submitted under Local Rule 34.1(a) (briefed but not argued); and (3) argued appeals. Then I computed the percentage affirmed or dismissed for each group:

Rule 27.4:                        95.64%               (344 cases)
Rule 34.1(a):                    92.11%               (1,001 cases)
Argued:                            57.14%               (301 cases).

The court does not hear argument in Rule 27.4 or Rule 34.1(a) cases. And yet, some appeals submitted under those rules are reversed or vacated, either in whole or in part. So the Third Circuit does reverse or vacate without oral argument (albeit not often).

The percentage affirmed or dismissed is quite a bit lower for argued cases than for other cases – no doubt the persons uttering the statements above had a sense of that. But the majority of argued cases still end with the judgment or order being affirmed or the appeal being dismissed (often on jurisdictional grounds).

The same pattern emerges looking appeals disposed of in FY 2012:

Rule 27.4:                       97.35%                  (302 cases)
Rule 34.1(a):                   91.32%                  (1,083 cases)
Argued:                           61.00%                  (359 cases).

What can you take away from the above? For one thing, if your appeal makes it through to the point that you argue before the Third Circuit, you can revise your initial estimate of your probability of success based on the patterns reflected above. To an appellant, things might look more favorable; to an appellee not so much. Another takeaway is that the majority of argued cases still end with the judgment under review left intact.

Judges’ reversal (or affirmance) rates

For those who are curious about how judges in the Third Circuit compare to one another on their reversal rates and who don’t want to pay for that information, I offer this table. Percent Affirmed by Judge, FY2010-FY2013.

The table lists judges of district courts in the Third Circuit who had more than ten appeals from their judgments in either of two three-year periods (FY 2010 to FY 2012, and FY 2011 to FY 2013). Three-year periods were used to smooth out year-to-year variation and to ensure a reasonable number of appeals for most judges. The listing shows 91 judges for the first three-year period and 93 judges for the second. A total of 38 judges – mostly magistrate judges (MJ) – were omitted from the table because there were fewer than 10 appeals from their judgments in both periods. The percentages show the percent of appeals that end with the judgment on review left intact (either because it was affirmed in its entirety or because the appeal was dismissed). A sense of a reversal rate (or more accurately, the percentage of appeals ending with something other than an affirmance or a dismissal) can be found by subtracting the listed percentage from 100. Rankings were assigned based on reported percentages, with the same ranking given to judges with the same percentage (e.g., if two or more judges had a reported percentage of 100, they were each assigned a “1”). Rankings range from 1 to 78 in both periods.

To give the reported percentages some context: across the 4,753 appeals in the FY 2010 to FY 2012 period captured in my data, 86.05% of those appeals ended with either an affirmance of the judgment or a dismissal of the appeal. Across the 4,524 appeals in the FY 2010 to FY 2012 period, 85.92% ended with either an affirmance of the judgment or a dismissal of the appeal. These percentages include the appeals from judgments issued by all judges, both listed in the table and omitted due to having too few cases.