Tag Archives: Administrative Office statistics

The Third Circuit’s oral argument rates-Part II: Attorney salaries to blame?

In my last post, I showed that even with corrections to remove the effects of changes in how the Administrative Office defines cases terminated on the merits, the Third Circuit’s oral argument rates have been generally declining over the FY 1997 to FY 2015 period:

Graph 1:

Oral Arg Rates Over Time

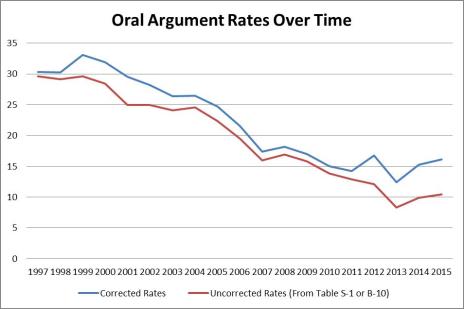
Based on available literature, this decline is not a new phenomenon and it’s not limited to the Third Circuit.  See, e.g., David R. Cleveland & Steven Wisotsky, The Decline of Oral Argument in the Federal Courts of Appeals: A Modest Proposal for Reform, 13 J. App. Prac. & Process 119, 142 (2012) (commenting on declines since the 1980s).  But putting aside the effects of case processing procedures that serve to enhance efficiency and other such forces, what’s contributed to the continuing downward trend?

 First Posited Reason:  Judicial Vacancies

Some have speculated that judicial vacancies explain the decline in the Third Circuit’s oral argument rates – particularly in recent years.  I don’t doubt that multiple vacancies that remain unfilled for several years can affect a judge’s decision to request oral argument in cases that are borderline.  But I don’t see that judicial vacancies can fully explain the blue line above.

Graph 2:

JudicVacGraph

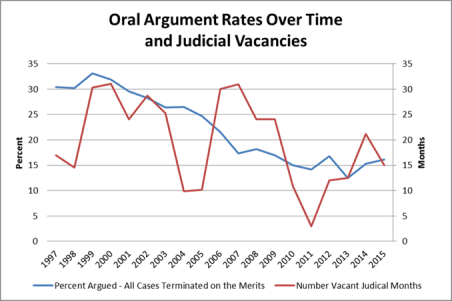
Graph 2 shows judicial vacancy months (red line) along with the corrected oral argument rates over time (blue line).  The Third Circuit has experienced multiple fiscal years with 24 or more vacant judicial months (the equivalent of at least two vacancies for the entire fiscal year).  Between FY 1999 and FY 2003 and again between FY 2006 and FY 2009, the number of vacant judicial months ranged from 24 to 31.  But oral argument rates have declined fairly steadily from about FY 1999 to about FY 2011, when they level off.  If judicial vacancies explained oral argument rates, those rates should both fall with increases in vacant judicial months and rise with decreases.  The graph above doesn’t reflect that – there’s no “uptick” in oral argument rates when the number of vacant judicial months drops.  Even if vacancies have had some effect, they are not the whole story.

 Second Posited Reason:  Pro Se Cases

Another possible reason for the declines in the oral argument rate (and the publication rate – another focus of recent attention) is the increase in the number of pro se cases now being litigated in the courts of appeal.  The Administrative Office’s statistics suggest that in FY 2015, just over 60% of all cases the Third Circuit terminated (both merit and procedural terminations) were pro se at the time of termination.  That’s a huge percentage, and much larger than it was in the late 1990s.  It would make sense that pro se cases are less likely to be argued.

 Pro Se Prisoner Petitions

Prisoner petitions are by far the most likely cases to be filed and prosecuted pro se.  Based on the Administrative Office’s statistics for the FY 1997 to FY 2015 period, the percentage of prisoner appeals that were prosecuted pro se was fairly constant: an average of 84% of U.S. prisoner petition appeals were pro se at termination, with a low of 76.4% (FY 2004) and a high of 90.1% (FY 2011).  An average of 88% of private prisoner petition appeals were pro se at termination, with a low of 83.6% (FY 2004) and a high of 93.5% (FY 2013).  If pro se prisoner petitions (1) are less likely to be orally argued and (2) made up an increasing percentage of the Third Circuit’s case load, then the combination could explain the declining oral argument rates over time.

But, over the FY 1999 to FY 2015 period, the percentage of all the Third Circuit’s cases terminated on the merits that were prisoner appeals was also fairly constant, averaging just under 19%.  In the midst of the period of declining oral argument rates, the percentage of prisoner petitions also declined, going from a high of 23.8% (in FY 2003) to a low of 13.7% (in FY 2010).  For that period, at least, prisoner petitions were making up a smaller – not larger – percentage of the cases that the Third Circuit terminated on the merits.

The relative steadiness of prisoner appeals as a percentage of all cases terminated on the merits and of pro se prisoner appeals may be why oral argument rates for prisoner petitions don’t show the same downward trend that all cases do:

Graph 3:

PPProSeGraph

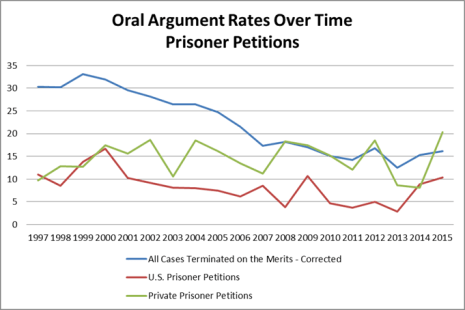
Pro se prisoner appeals do not appear to be the explanation for declining oral argument rates over time.

 Other Private Civil Appeals

Where an increase in pro se cases may have a substantial effect on oral arguments rates is in the category of other private civil appeals (a category that includes every civil appeal that is not a prisoner petition or a bankruptcy appeal).  Oral argument rates for such appeals show the same downward trend as the overall rate does, although the decline is sharpest after around FY 2006:

Graph 4:

OPCAppGraph

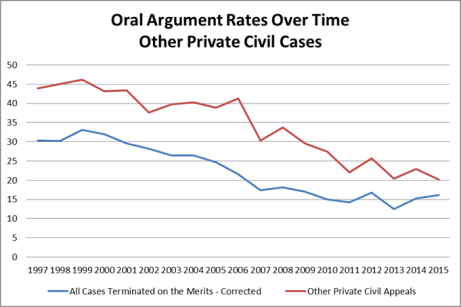
Between FY 1997 and FY 2006, the Third Circuit heard argument in an average of just under 42% of cases falling into the “other private civil appeals” category.  The oral argument rate dropped dramatically after FY 2006: between FY 2007 and FY 2015, the average rate was 25.79%.  So what happened after FY 2006?

Graph 5:

OPCAppProSeGraph

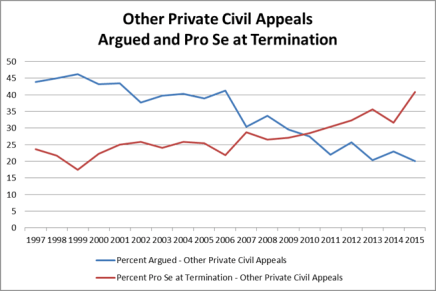
Before FY 2006, the percent of other civil cases that were pro se at termination was, at its highest, just over 25%.   After FY 2006, the smallest percent pro se at termination was over 26% and averaged about 31%.  And, as Graph 5 shows – pretty dramatically – as the percent pro se goes up the oral argument rate generally goes down and as the percent pro se goes down the oral argument rate generally goes up.

Bottom line: the increase in the percentage of other private civil appeals that were prosecuted pro se may be a reason for the declining oral argument rates over time.

The other private civil appeals category is not the only one for which the percent pro se at termination has increased.  A much larger percentage of criminal appeals were pro se at termination starting in FY 2009.  The percentage of agency appeals that were pro se at termination jumped for a brief period between FY 2000 and FY 2002.  Another jump in the percent pro se began in FY 2012.  Why are more cases being prosecuted pro se?

This leads me to show one more graph:

Graph 6:

AttySalGraph

Attorney salaries were increasing over the 1998 to 2010 period, after which they leveled off.  As I mentioned above, oral argument rates in the Third Circuit have declined fairly steadily from about FY 1999 to about FY 2011, when they level off.

Coincidence?


What’s behind declining oral argument rates in the Third Circuit – Part I

A paltry 10.4%.

The Administrative Office’s published oral argument rate for the Third Circuit for fiscal year 2015 will undoubted evoke commentary – much has been made of the Third Circuit’s relatively low rate for several years now. This is a bit of surprise: the Third Circuit has had relatively low oral argument rates for nearly 20 years. In fact, in 1997, it had the lowest rate of the 12 federal courts of appeal for which the Administrative Office publishes statistics – 29.6%. For many of the subsequent 19 years, only the Fourth Circuit’s, Eleventh Circuit’s or Fifth Circuit’s rates were lower than those of the Third Circuit. Bottom line: the Third Circuit’s FY 2015 oral argument rate is at the low end of the spectrum, but that is where the Third Circuit has historically been.

The Third Circuit’s rates have also been declining over time. But oral argument rates having been declining over time across all circuit courts. In FY 1997, for example, the highest oral argument rate was 64.9%. In FY 2012, the highest reported rate was 38.3%. Although it was back up to 56.4% for FY 2015, the last time any circuit court had a reported rate of over 60% was in FY 2003.

What’s going on? Are circuit courts simply more likely to decline to hear argument, or does something else explain the declines in reported rates over time?

Turns out the Administrative Office’s published oral argument rates have declined over time for several different reasons, some of which have nothing to do with what’s going on in the circuit courts.

First Reason:
The Administrative Office has changed how the denominator is defined.

For FY 1997, oral argument rates were computed as:

 The number of cases for which oral argument was heard    x 100
    The total number of cases terminated on the merits

Compare Table B-1 to Table S-1 (under the new numbering system, Table S-1 is now Table B-10) in the set of tables associated with the Administrative Office’s Judicial Business report for FY 1997. The total number of cases terminated on the merits did not include cases disposed of by consolidation or procedural terminations. See Table B-1. Thus, the reported percent in Table S-1 was the percent of all cases terminated on merits for which oral argument was heard. Simple enough.

But in 1998, the Administrative Office added significantly to the types of cases included in its “original proceedings” category. (Check the footnotes at the end of Table B-1 for FY 1998). It again changed the types of cases included in the “original proceedings” category in 2014 (to include “miscellaneous applications”).

These changes increased the size of the “total number of cases terminated on the merits” — i.e., the denominator in the formula used to calculate oral argument rates. Original proceedings are generally not cases that require oral argument, and so changes to the cases included in the original proceedings category substantially increased the denominator without causing a commensurate increase in the numerator. As a result, the reported percentages dropped.

The same effect, but for a different reason, occurred in FY 2012. Before FY 2012, terminations via a denial of a certificate of appealability were counted as procedural terminations. See, for example, Table B-5A for FY 2011. But since FY 2012, the Administrative Office has counted cases terminated through denial of a certificate of appealability as cases terminated on the merits. See Table B-5 for FY 2012. For the Third Circuit, this change added 334 cases to the denominator in FY 2012, again without causing a commensurate change in the numerator. Oral argument rates could be expected to decline for all circuit courts that regularly see a sizeable number of requests for a COA. (This may partly explain why, after FY 2012, the D.C. Circuit has consistently had the highest oral argument rate).

Second Reason:
The Administrative Office’s published rate is simply wrong.

This is does not explain much, but does show up in one year’s published rates in Table S-1: those for FY 2012. In that year, for whatever reason, the Administrative Office “forgot” to remove consolidated cases from the figure used as the denominator. As a result, for courts that had a sizeable number of consolidated cases in that year, the denominator was too high, making the published rate artificially low.

The effects of the Administrative Office’s errors and changes.

Removing all original proceedings cases (both those argued and not argued), all certificate of appealability cases after FY 2011, and all consolidated cases for FY 2012 allows figures for all years between FY 1997 and FY 2015 to be directly compared. The graph below shows the effect of these changes on rates for the Third Circuit:

Oral Arg Rates Over Time

As expected, the corrected rates are in all instances greater than the uncorrected rates (the blue line is above the red line throughout the period). Notably, the corrected rate for FY 2015 is 16.14% – still comparatively low, but not 10.4%.

The blue line still shows a general decline over time, suggesting that other forces are also work to reduce the oral argument rate. Possible reasons will be the focus of a future post.

Labor appeals in the Third Circuit: Is your chance of any success less than 1 in 10 or closer to 1 in 4?

You represent plaintiffs in a Fair Labor Standards Act case.  Yesterday you received notice that the district court granted the defendant’s Rule 12(b)(6) motion and dismissed all your claims. Being a rational lawyer, you’ve set aside your feelings of anger and frustration and are looking for information on what the chances might be that the Third Circuit will reverse or vacate any part of the judgment on appeal.  You’d be happy with an outcome that allows you to proceed with at least some of your original claims.

The Administrative Office of the U.S. Court’s recently published statistics show you that in FY 2014, 8.7% of all “Other Private Civil” appeals were reversed. See Table B-5. Based on that number, it seems you have a less than a 1 in 10 chance.  Now you’re really depressed.

But all is not lost. First, the 8.7% figure does not reflect partial victories; appeals in which the judgment was reversed in part are included in the “Affirmed” column in the Administrative Office’s statistics.  (Check out the fine print at the bottom of Table B-5).  That means 8.7% may be an estimate of complete success, but it does not reflect partial success.

Second, the best that can be said about the cases that 8.7% is based on is that they do not include criminal cases, U.S. prisoner petitions, other U.S. civil cases, private prisoner petitions, bankruptcy cases, administrative agency appeals, or original proceedings. In short, Fair Labor Standards Act cases are in the category of “other private civil” cases, but so are antitrust, intellectual property, employment discrimination, tort, contract, and a host of other cases.

Using data I’ve collected, I’ve posted before some information on the percent of various types of civil-case appeals the Third Circuit affirmed or dismissed (and thus reflect, when subtracted from 100, the percentage of appeals in which the appellant gained some change in the district court’s judgment).  That information was only for FY 2013.  I now have similarly detailed information for FY 2010 through FY 2014, along with percentages across those five years.  Percent of Other Civil Appeals Affirmed or Dismissed, by Case Type and Fiscal Year. (This Table is also posted on the Statistics page, under “Third Circuit Statistics.”)  The numbers in the Table are far from ideal – they do not reflect, for example, the percent of judgments affirmed in Fair Labor Standards Act cases – but they are more useful than what’s generally available.

Within a case-type category (e.g., Tort), the figures in the Table bounce around a bit across years.  Because the bounces generally don’t reflect a trend up or down, I’ve computed a five-year figure as well (the last column) that shows the percent affirmed or dismissed across all appeals in the same category over the FY 2010 to FY 2014 period.

Fair Labor Standards Act cases are in the “Labor” category. Per-fiscal year figures for Labor cases range from a high of 82.2% in FY 2010 to a low of 63.3% in FY 2012.  In my FY 2014 data set, the judgment was affirmed or dismissed in 67.6% of Labor appeals.  Across the five years, the number is 74.2%.  So, my data suggest that the Third Circuit affirmed the district court’s judgment or dismissed the appeal in just over 74% of the Labor appeals it decided between FY 2010 and FY 2014.  That suggests a 1 in 4 chance of getting some sort of relief from the district court’s judgment.

To get a sense of how “low” this number is, look at the comparable overall percent for all “other civil appeals” – it’s 83.2%. In short, it appears that judgments in Labor cases have a much smaller chance of being affirmed or dismissed than most every other type of civil appeal reflected in the Table.  In fact, Labor appeals in my data set had the smallest percent affirmed or dismissed of all “other” civil cases for three of the five years shown.  That translates to a higher probability of success for the appellant.

Feeling any better now?


Don’t believe the reported numbers – Your chances of getting a reversal in the Circuit Courts are not going down

A glance over the last two years of statistics reported by the Administrative Office may lead you to think that the chances of getting a “pure” reversal are going down. Of all terminations on the merits across all the regional circuit courts, statistics for the “percent reversed” went from 8.9% in FY 2011 to 6.8% in FY 2012.  See Judicial Business 2012, Table B-5 and compare the information there to Judicial Business 2011, Table B-5. In the Third Circuit, those percentages went from 9.4% in FY 2011 to 6.4% in FY 2012.  The numbers for the Fifth Circuit went from 8.0% in FY 2011 to 5.4% in FY 2012 and the Ninth Circuit went from 11.8% to 7.7% in the same period. In fact, all but two of the 12 regional circuits saw declines of some sort; only the Seventh Circuit’s numbers went up, and then did so by a small amount.  The numbers for the Sixth Circuit were unchanged.

I suppose that a change in the mix of cases could explain part of these declines.  It’s not unusual to see the numbers bounce over time in a single circuit court, going up one year and going down the next, likely because of the mix of cases that court terminates.  But these bounces tend to cancel each other out in the overall numbers because some circuits see declines while others see upticks.  This explains why the percent reversed across all circuit courts hovered around 9.6% (plus or minus .6%) between FY 1997 and FY2011.  So it is surprising to see 10 of 12 circuit courts move in the same direction and to see the overall percent reversed to go down by over two percentage points.

So what gives?  What I found is one of the frustrations of dealing with reported statistics – unexplained changes in the way data are handled.  Bottom line – the percent reversed figures reported for FY 2012 are not comparable to the earlier percentages.

If you go through the online version of the 2012 Judicial Business report, you’ll find a notation to changes the Administrative Office made to the way its data are reported. The percent reversed numbers above come from Table B-5, and the 2012 Report explains that Table B-5 now presents “data on cases disposed by consolidation” whereas in prior years Table B-5 “did not provide such data.”

Ok, but that change doesn’t explain what happened to the percent-reversed figures.  That’s because the “consolidation” change affected neither of the numbers used to calculate those percentages.

What the Administrative Office doesn’t explain (at least I couldn’t find it) is that another change in the way it did things in the 2012 Report was to now treat certificate of appealability terminations as terminations on the merits. See that column labeled “Cert. Appealability” under the overall heading of “Terminations on the Merits” in Table B-5 of the 2012 Report? That column does not appear in Table B-5 in the 2011 or 2010 reports. In those reports – and in fact in all reports going back to 1997 – the “Cert. Appealability” column is in Table B-5A because those dispositions were considered procedural terminations, not merit terminations.  Why are certificate of appealability terminations all of a sudden merit terminations?  No clue.

The effect of the change, however, is to make the number of cases terminated on the merits larger, and as a result, to reduce the percentage of cases reversed.  So the 3 percentage point decline in the Third Circuit probably has more to do with the fact that certificate of appealability terminations represented over 14.5% of the total number of dispositions on the merits than anything having to do with how judges see things. Taking certificate of appealability terminations out of the base leads to a “revised” percent reversed of 8.3% for all circuits, and of 7.5% for the Third Circuit – both still smaller than in FY 2011, but not by huge margins.  The revised percent reversed for the Ninth Circuit is 11.25%, a mere .5% decline from the FY 2011 figure.  Although the change in the way certificate of appealability terminations are treated doesn’t explain all the declines in the reported statistics (e.g., the percent reversed in the D.C. Circuit went from 15.0% to 8.9%, but that court had only 7 certificate of appealability terminations in 2012), it does explain a sizeable portion of them.

How long will an appeal take?

Looking for a better answer than “It depends”?

The Administrative Office of the U.S. Courts produces for every fiscal year (Oct. 1 to Sept. 30) a report of the “Judicial Business of the United States Courts.” Included in that report is information about the median time it takes to go through the various stages of an appeal, including the time it takes to go from filing a notice of appeal to a final decision. (See, for example, Judicial Business 2011, at Tables B-4, B-4A to B-4D).

My office is in Pittsburgh, which is in the Third Circuit. For cases the Third Circuit decided on the merits in fiscal year 2011 (October 2010 to September 2011), the median number of months between the filing of the notice of appeal and final disposition was 9.7 (Table B-4). For fiscal year 2012, the comparable number is 7.7 (See Judicial Business 2012, at Table B-4). What do those numbers mean?

Well, generally they mean that 50% of 2,484 cases decided on the merits in 2011 were decided by the time 9.7 months had passed. Same for 2012: 50% of 2,493 cases decided on the merits were decided in 7.7 months. What about the other 50%? Those cases took longer than 9.7 months in 2011 and longer than 7.7 months in 2012. How much longer? The tables provide no clue.

So, what can you say about how long an appeal will take in the Third Circuit? All you can say is that half the cases that court decided in the last fiscal year were decided in 7.7 months.

Does that mean your appeal has a fair chance of being decided in 7.7 months? No.

Whether your appeal takes less than 7.7 months or substantially longer than 7.7 months depends in part on whether it is more like the “lower” half of 2,493 cases decided on the merits in FY 2012 or more like the “upper” half of those cases. Rather than look just at the overall numbers, dig a bit deeper and look at Tables B-4A through B-4D. Those tables won’t give you exactly what you’re looking for either, but they’ll provide better information than Table B-4 will.

In Table B-4A, for example, you’ll see that the median number of months it took to decide 596 criminal appeals in FY 2012 was 11.7 – i.e., 4 months longer than the overall median. The Third Circuit decided half of the 616 “other civil cases” (civil cases other than a prisoner petitions) in 10.5 months. The median for bankruptcy appeals was 10.4 months (Table B-4B). On the other hand, the median for prisoner petition cases (of which there were 627 in FY 2012, making it one of the largest subcategories of cases) was 4.1 months (Table B-4A) and the median for original proceedings was 1.3 months (Table B-4D).

The 7.7 month “overall” median reflects all of these cases (and administrative proceedings as well – see Table B-4C). So, is your appeal more like a prisoner petition case or more like a criminal case, a standard civil case, or a bankruptcy appeal? The answer to that question will help you decide if any of the reported statistics are useful to you and which may be most useful.